Annual Waterfront Market Review · 2024 Closed Sales
2024 Lake St. Clair Waterfront Market Report
A detailed look at 2024 waterfront home sales across Harrison Township, St. Clair Shores, Chesterfield Township, New Baltimore and the Grosse Pointe communities—including pricing, sold price per square foot, market time and the transactions that defined the year.
What Defined 2024
Volume in the core markets. Scarcity at the top.
The year combined meaningful transaction volume in Harrison Township, St. Clair Shores and Chesterfield Township with a very small number of high-value estate sales that pushed regional averages upward.
Two sales finished above $4 million
50950 Redwood Lane in New Baltimore closed at $4.18 million, while 66 Lake Shore in Grosse Pointe Farms closed at $4.175 million. Those two transactions were separated by only $5,000 and represented the luxury peak of the 2024 waterfront market.
Harrison Township remained the volume leader
Harrison Township accounted for 47 of the 92 waterfront sales reviewed—more than half of total regional activity. The city's wide range of property types makes median pricing especially useful when interpreting the market.
Average and median told different stories
Across the region, the average sale price was $832,392, while the median was $625,000. That gap reflects the effect of a limited number of multimillion-dollar transactions on the overall average.
Market time was similarly skewed
The average market time was 57 days, but the median was only 27 days. Extended listings—particularly in small luxury segments—pulled the average higher than the experience of the typical transaction.
2024 Market Takeaways
Four numbers worth understanding
A citywide statistic is only useful when it is placed in context. Waterfront type, scarcity, boating access and a small number of exceptional sales can materially change the headline numbers.
51% of the reviewed sales were in Harrison Township.
Its 47 transactions made it the deepest waterfront market in the 2024 data.
St. Clair Shores averaged approximately 97% of original list price.
That was the strongest result among the three communities with at least ten waterfront sales.
Chesterfield recorded a 21-day median market time.
The fastest median among Harrison Township, St. Clair Shores and Chesterfield Township.
Luxury sales changed the averages.
New Baltimore's $4.18 million sale pushed its average to nearly $1.47 million despite a median of only $605,000.
Waterfront Community Comparison
2024 closed-sale performance by city
The comparison below separates the major Lake St. Clair waterfront communities represented in the 2024 closed-sales data. Smaller samples provide useful luxury-market context, but they should not be interpreted with the same statistical confidence as the higher-volume markets.
Waterfront market | Sales | Average sale | Median sale | Avg. sold $/SF | Avg. DOM | Sale / original list | Sale range |
|---|---|---|---|---|---|---|---|
Harrison Township Canal, river, channel and direct lakefront | 47 | $709,743 | $628,000 | $278 | 61 | 94.6% | $450,000–$2,225,000 |
St. Clair Shores Residential canal, basin and select direct lakefront | 25 | $680,672 | $575,000 | $276 | 42 | 97.0% | $451,000–$2,150,000 |
Chesterfield Township Canal, Anchor Bay and direct waterfront | 12 | $762,542 | $719,000 | $306 | 47 | 94.0% | $465,000–$1,583,700 |
New Baltimore Anchor Bay, canal and direct shoreline properties | 4 | $1,469,975 | $605,000 | $317 | 70 | 94.5% | $489,900–$4,180,000 |
Grosse Pointe Farms Rare direct Lake St. Clair estate waterfront | 1 | $4,175,000 | $4,175,000 | $661 | 6 | 111.3% | $4,175,000–$4,175,000 |
City of Grosse Pointe Limited direct waterfront opportunities | 2 | $2,025,000 | $2,025,000 | $545 | 26 | 94.0% | $1,850,000–$2,200,000 |
Grosse Pointe Shores Direct Lake St. Clair estate waterfront | 1 | $2,950,000 | $2,950,000 | $426 | 355 | 78.7% | $2,950,000–$2,950,000 |
Swipe horizontally to view the complete comparison.
City-by-City Market Insights
The numbers—and the waterfront story behind them
Waterfront statistics become more useful when interpreted through the type of water, property scarcity, boating access and buyer profile within each community.
Harrison Township accounted for 47 of the 92 closed waterfront sales reviewed in 2024. Its median sale price of $628,000 was far below its highest sale of $2.225 million, illustrating how broad this market is. Canal characteristics, route to open water, dockage, frontage and property condition remain critical when comparing homes.
25 closed sales · 2024
St. Clair Shores
High-volume market with strong sale-to-original-list performance
St. Clair Shores recorded 25 waterfront sales and the strongest average sale-to-original-list ratio among the three highest-volume communities at approximately 97.0%. A $2.15 million high sale widened the overall range, while the $575,000 median better reflects the center of the market.
Chesterfield Township produced 12 closed waterfront sales, a $719,000 median sale price and a 21-day median market time—the fastest median among the three highest-volume communities. Its average sold price per square foot also exceeded Harrison Township and St. Clair Shores.
New Baltimore’s four-sale sample was heavily influenced by the $4.18 million sale at 50950 Redwood Lane. The city’s $1.47 million average sale price therefore overstates the middle of the local market; its $605,000 median provides a more useful measure of typical 2024 activity.
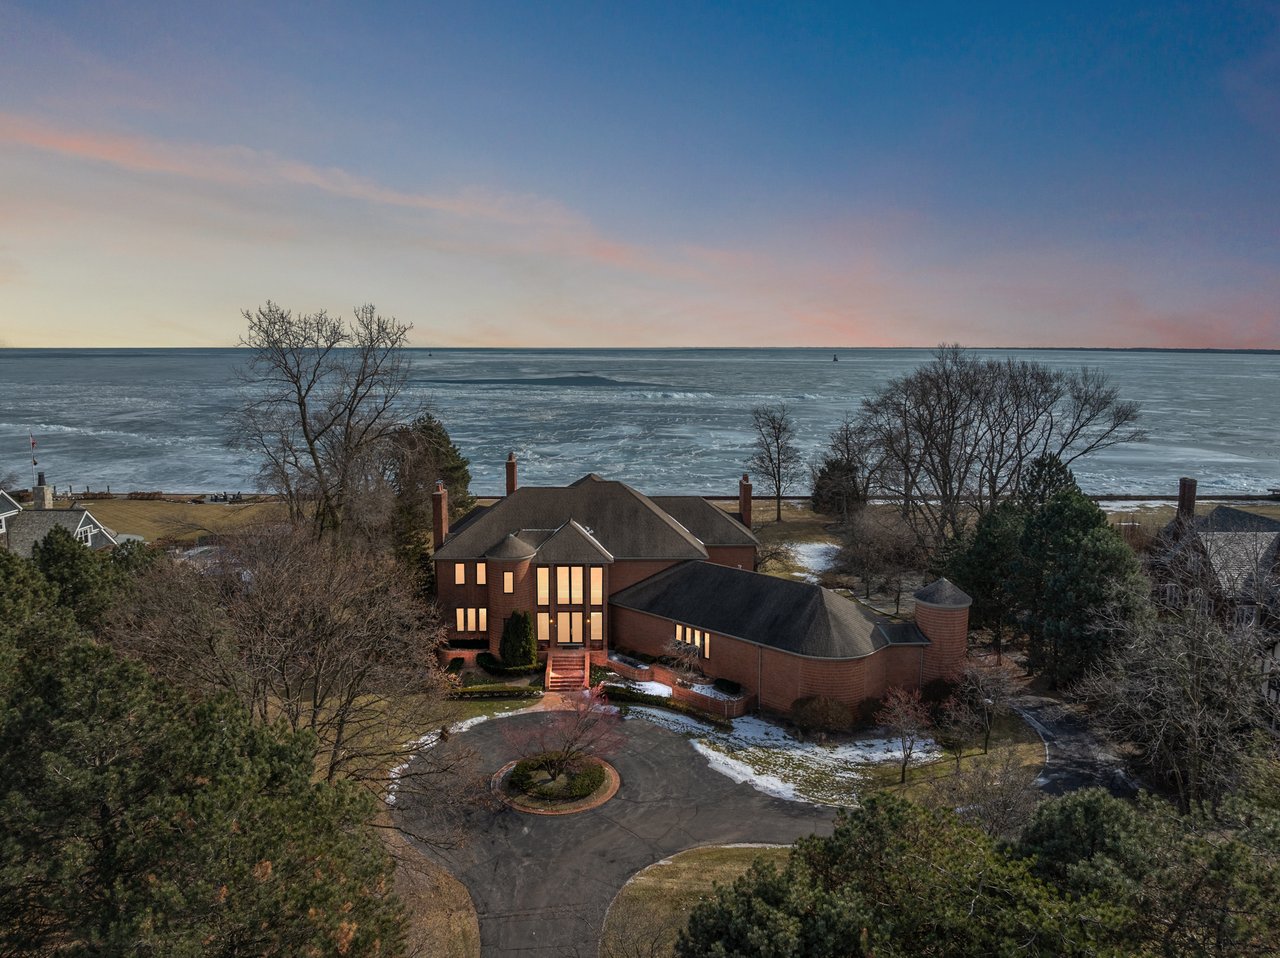
The single represented waterfront sale in Grosse Pointe Farms was 66 Lake Shore at $4.175 million—only $5,000 below the year’s highest transaction. The property closed above its $3.75 million original asking price, demonstrating how scarcity and exceptional estate quality can produce results that differ sharply from broader averages.
The City of Grosse Pointe recorded two sales averaging $2.025 million, with both transactions within a relatively narrow $1.85 million to $2.20 million range. The limited sample reflects the scarcity of direct waterfront inventory in this community.
Only one Grosse Pointe Shores waterfront sale was represented in 2024, closing at $2.95 million after an extended market period. A one-sale sample should not be used as a citywide benchmark, but it reinforces the limited turnover and highly property-specific nature of this luxury waterfront segment.
Defining Waterfront Sales of 2024
Two transactions finished within $5,000 of one another
The highest end of the 2024 market was defined by two very different waterfront settings: Anchor Bay in New Baltimore and direct Lake St. Clair frontage in Grosse Pointe Farms.
Highest Waterfront Sale · 2024 $4,180,000
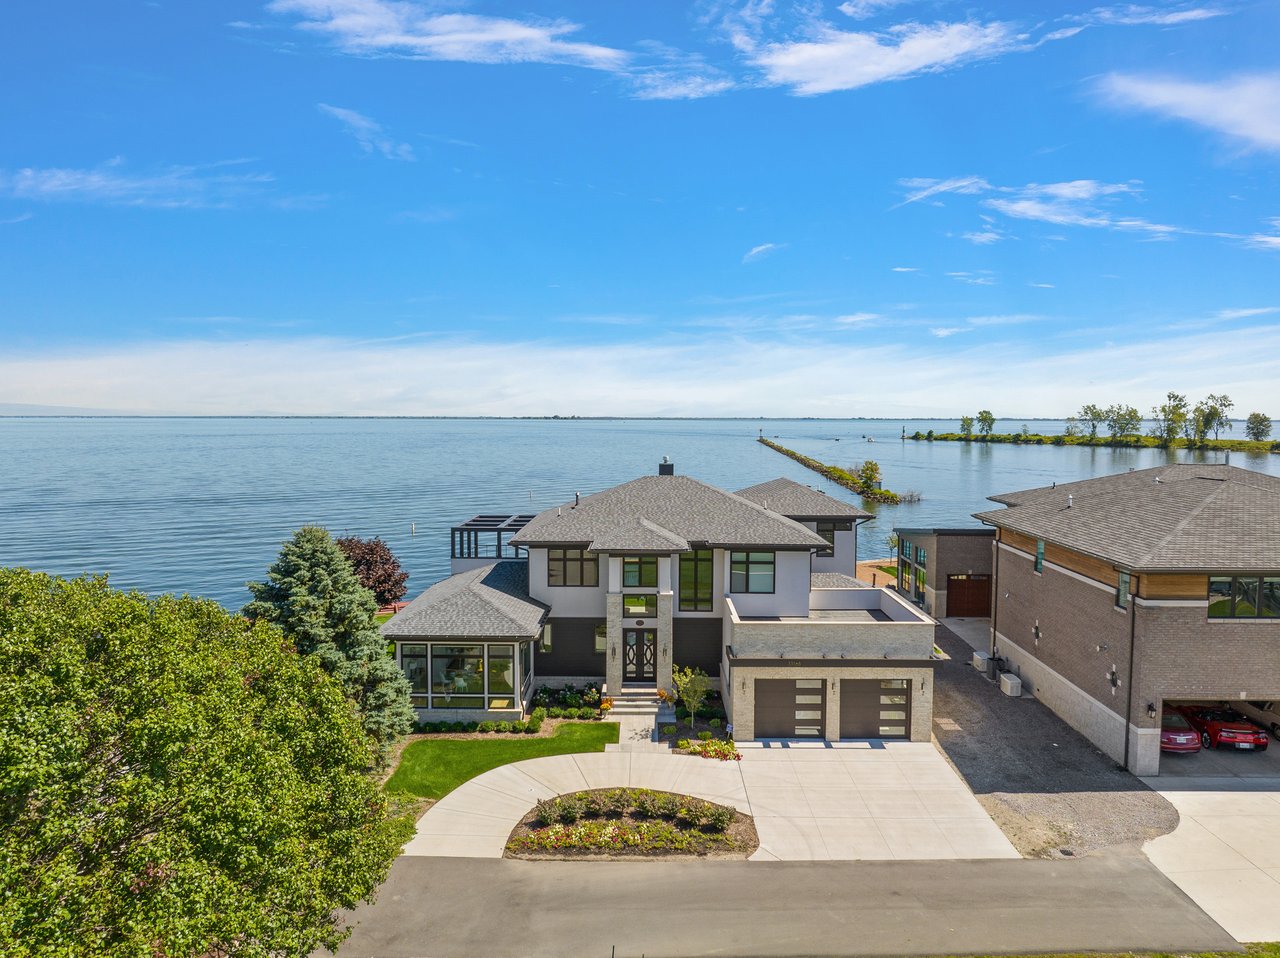
50950 Redwood Lane
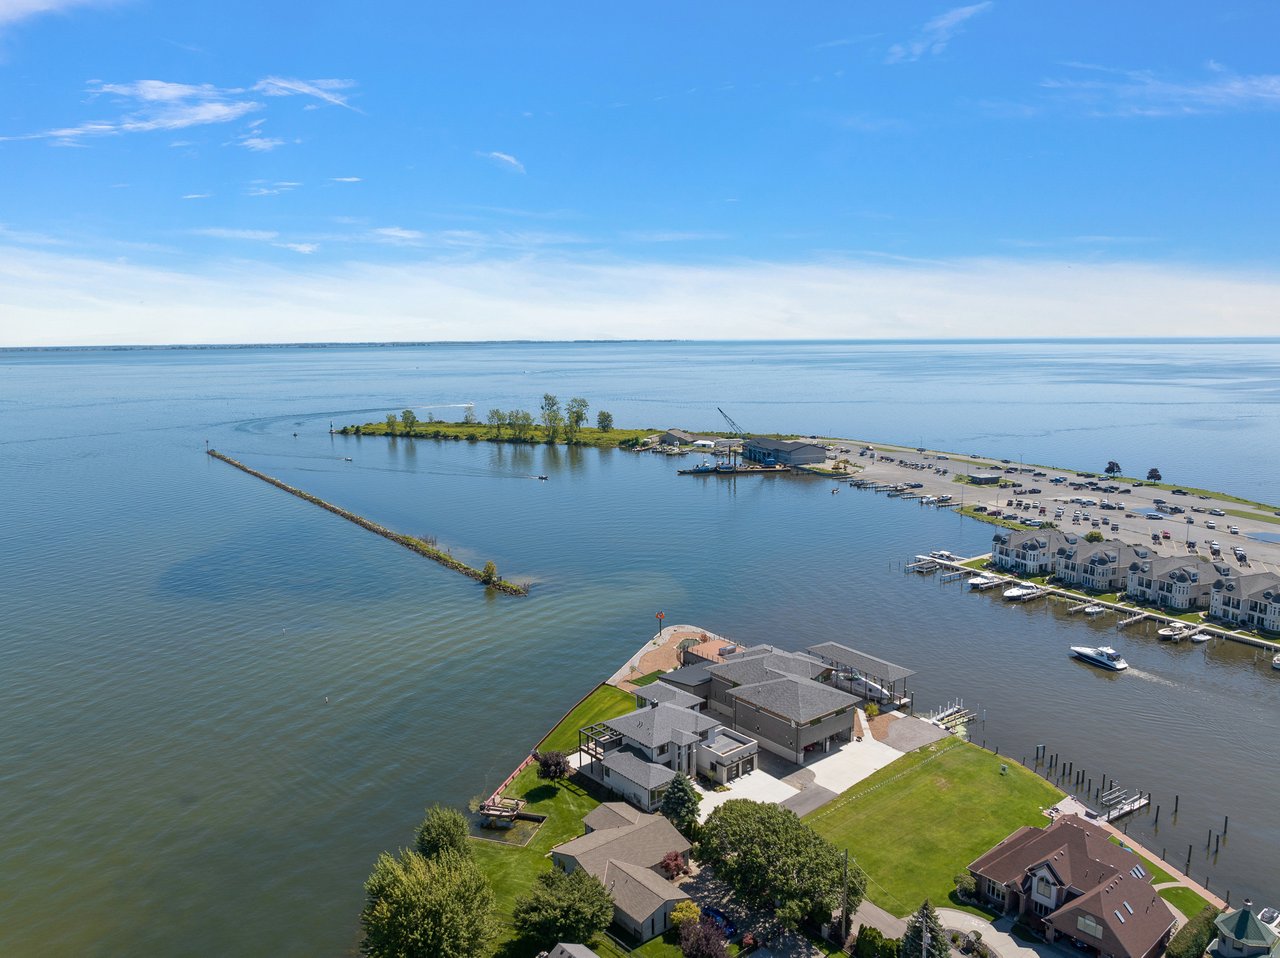
New Baltimore · Closed from a $4.45 million original list price after 136 days on market. At approximately $501 per square foot, this transaction materially influenced New Baltimore's 2024 average.
Second-Highest Waterfront Sale · 2024 $4,175,000
66 Lake Shore
Grosse Pointe Farms · Closed above its $3.75 million original asking price after six days on market. At approximately $661 per square foot, it was one of the strongest luxury results represented in the 2024 data.
Reading Waterfront Data Correctly
Why averages alone cannot price a waterfront home
A city average combines properties with different water access, frontage, depth, views, dock infrastructure, lot sizes and home quality. A protected canal home, an Anchor Bay property and a direct Lake St. Clair estate may all be labeled “waterfront” while competing for very different buyers.
The 2024 data demonstrates this clearly. New Baltimore averaged nearly $1.47 million despite a $605,000 median because one $4.18 million transaction represented the top of its four-sale sample. Grosse Pointe Farms and Grosse Pointe Shores had only one represented waterfront sale each, making those results useful examples—but not dependable citywide averages.
A credible waterfront valuation should therefore begin with the property's actual competitive set: type of water, navigational route, frontage, shoreline condition, dockage, exposure, outdoor experience, home condition and the buyers most likely to value those characteristics.
Market information is based on 92 waterfront residential sales closed during 2024 in the supplied MLS data. Figures are arithmetic averages unless otherwise noted and may include multiple waterfront property types within each municipality. Information is deemed reliable but not guaranteed and should not replace a property-specific market analysis. Results in communities with limited sales may be disproportionately influenced by individual transactions.