01
Closed pricing remained above the prior full-year median.
The regional median reached $715,000 and the average reached $918,864. A limited number of estate sales continued to pull the average above the typical transaction.
Along the Shore / Market Intelligence
A detailed review of waterfront homes priced at $450,000 and above with direct water or canal access—including closed sales, active competition, pending activity, pricing and the transactions shaping the market.
One lake. Distinct markets.
Where the shoreline defines the market.
2026 at a glance
Closed results tell one part of the story. Active and pending inventory reveal the competition sellers face entering the second half of the year.
55
63
11
$715K
$313
41
The market’s defining sale
The upper end remained highly property-specific. This direct-lakefront transaction helped lift the regional average well above the $715,000 median.
What defined the market
Healthy closing volume continued, but a larger and older pool of active inventory increased the importance of pricing, presentation and community-specific positioning.
01
The regional median reached $715,000 and the average reached $918,864. A limited number of estate sales continued to pull the average above the typical transaction.
02
Sixty-three active listings competed with 55 closed sales. The $690,000 median active asking price remained close to the regional median sale price.
03
Closed waterfront properties averaged 93.7% of original list price. Performance varied meaningfully by community, price tier and water-access profile.
04
The regional average was 75 days while the median was 41. Long-running luxury and specialty listings continued to pull the average higher.
Current inventory context
Active and pending properties are kept separate from closed-sale averages, but they provide essential context for pricing, timing and buyer depth.
The second half of 2026 is not simply a low-inventory market. It is a selective market in which buyers can compare more than 60 active waterfront options across the communities represented.
Waterfront community comparison
Sold metrics are calculated only from closed transactions. Active and pending counts remain separate to preserve an accurate view of closed-sale performance.
Market | Sold | Active | Pending | Avg. sale | Median sale | Avg. $/SF | Median DOM | Sale/original | Highest sale |
|---|---|---|---|---|---|---|---|---|---|
Harrison Township Canal, river, channel and direct lakefront | 23 | 40 | 7 | $808,987 | $655,000 | $303 | 53 | 92.7% | $1,835,000 |
St. Clair Shores Canal, basin and select direct lakefront | 19 | 13 | 2 | $755,211 | $585,000 | $289 | 27 | 96.3% | $1,400,000 |
Chesterfield Township Canal, Anchor Bay and direct waterfront | 9 | 8 | 0 | $1,061,222 | $1,000,000 | $345 | 19 | 92.0% | $1,850,000 |
New Baltimore Anchor Bay, canal and direct shoreline | 2 | 2 | 2 | $740,400 | $740,400 | $322 | 57 | 98.0% | $756,000 |
Grosse Pointe Park Rare direct Lake St. Clair estate waterfront | 2 | 0 | 0 | $3,275,000 | $3,275,000 | $501 | 58 | 84.0% | $4,250,000 |
Swipe horizontally to view the complete comparison on mobile.
23 sold · 40 active · 7 pending
The region’s volume leader also carried the deepest active inventory. Its $655,000 median sale price, 53-day median market time and 92.7% sale-to-original-list ratio reinforce the importance of disciplined positioning.
19 sold · 13 active · 2 pending
St. Clair Shores posted the strongest original-list-price retention among the higher-volume communities and a faster 27-day median market time.
9 sold · 8 active · 0 pending
The core volume market’s highest median sale price paired with its fastest median market time. Its 92.0% sale-to-original-list ratio also shows meaningful negotiation at the upper end.
2 sold · 2 active · 2 pending
A balanced active and pending count accompanied a $740,400 median sale price and 98.0% original-list-price retention. The small sample should be interpreted cautiously.
2 sold · 0 active · 0 pending
Two luxury transactions defined the market’s ceiling. Their $3.275 million average is not a citywide benchmark; it reflects the highly individual nature of direct-lakefront estates.
Largest waterfront sales
The five highest closed sales included direct-lakefront estates, high-value canal homes and distinctive properties with exceptional frontage or boating access.
01
Grosse Pointe Park
$4,250,000
02
Grosse Pointe Park
$2,300,000
03
Chesterfield Township
$1,850,000
04
Harrison Township
$1,835,000
05
Harrison Township
$1,800,000
Second-half 2026 outlook
Qualified waterfront buyers remain active, but results vary sharply by community, price tier, property type and the quality of the water-access experience.
Sellers entering the late-summer or fall market should evaluate active competition carefully. In Harrison Township especially, active inventory materially exceeded year-to-date closing volume. Pricing from an aspirational listing instead of a relevant closed sale can make a property difficult to distinguish.
For owners considering a spring 2027 sale, this is the period to complete repairs, document seawall and dock improvements, capture late-summer photography and establish the launch strategy before the next seasonal window.
“The strongest result comes from matching the property to its specific waterfront market—not treating every shoreline home as comparable.”
Confidential waterfront valuation
Receive a property-specific valuation that considers the home, lot, frontage, water access, shoreline, dockage, current competition and the buyers most likely to recognize its value.
Explore Lake St. Clair waterfront sales, active inventory, pending homes, pricing and market time through July 31, 2026.
Meet our team.
Waterfront
Jeff Meldrum | July 31, 2026
Lake St. Clair waterfront market report, Lake St. Clair real estate trends 2026, Grosse Pointe waterfront homes for sale, Grosse Pointe Shores lakefront real estate, S… Read more
Waterfront
Jeff Meldrum | November 10, 2026
Learn what makes the best agent to sell a waterfront home on Lake St. Clair and why specialized waterfront expertise can maximize your home's value and exposure.
Waterfront
Jeff Meldrum | March 10, 2026
An Insider's Guide
Waterfront
Jeff Meldrum | May 13, 2026
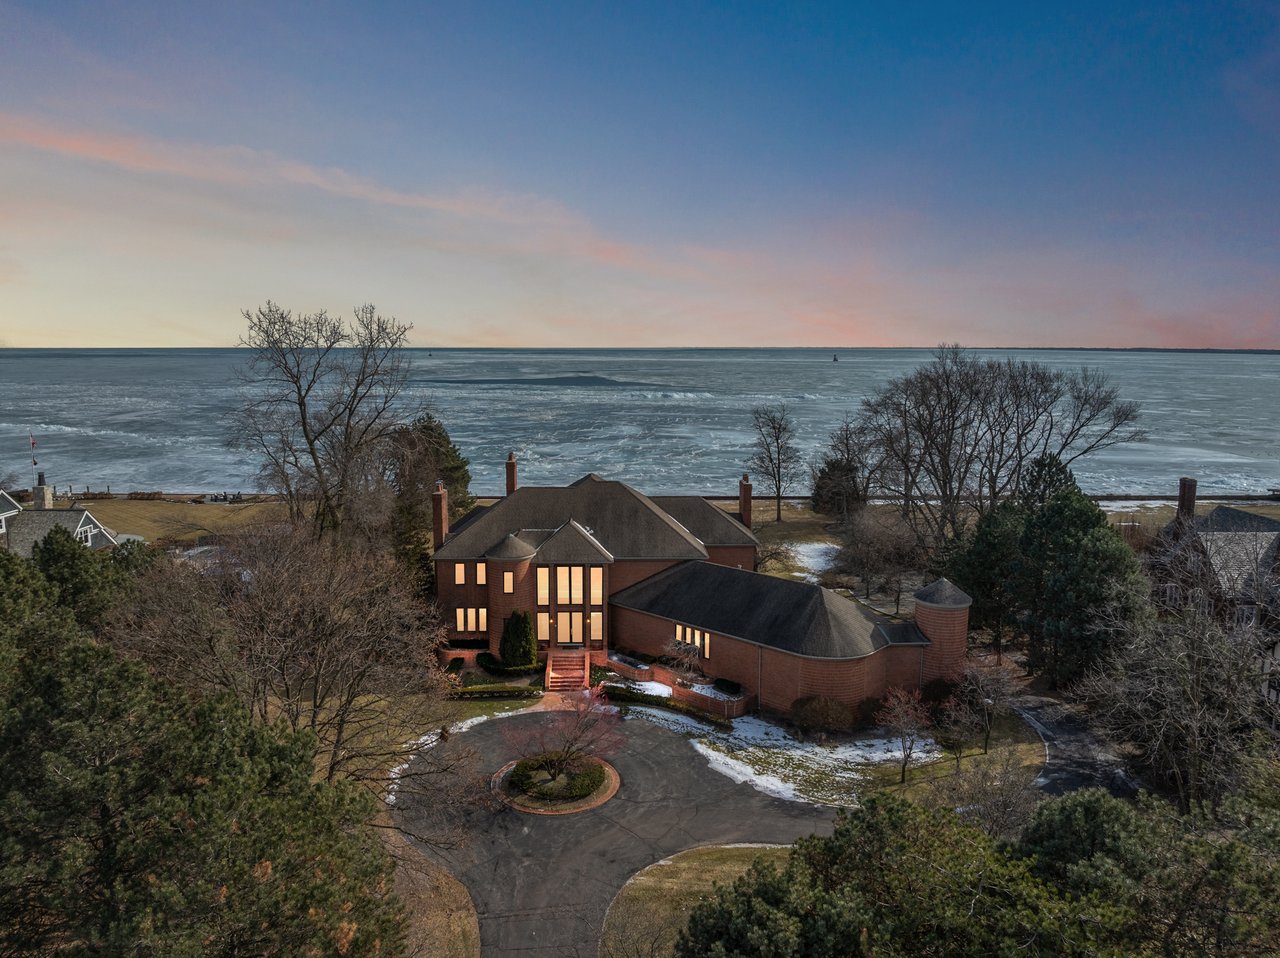
What every serious buyer needs to know before making an offer — from canal depth to flood insurance to finding the right community.
Waterfront
Jeff Meldrum | May 14, 2026
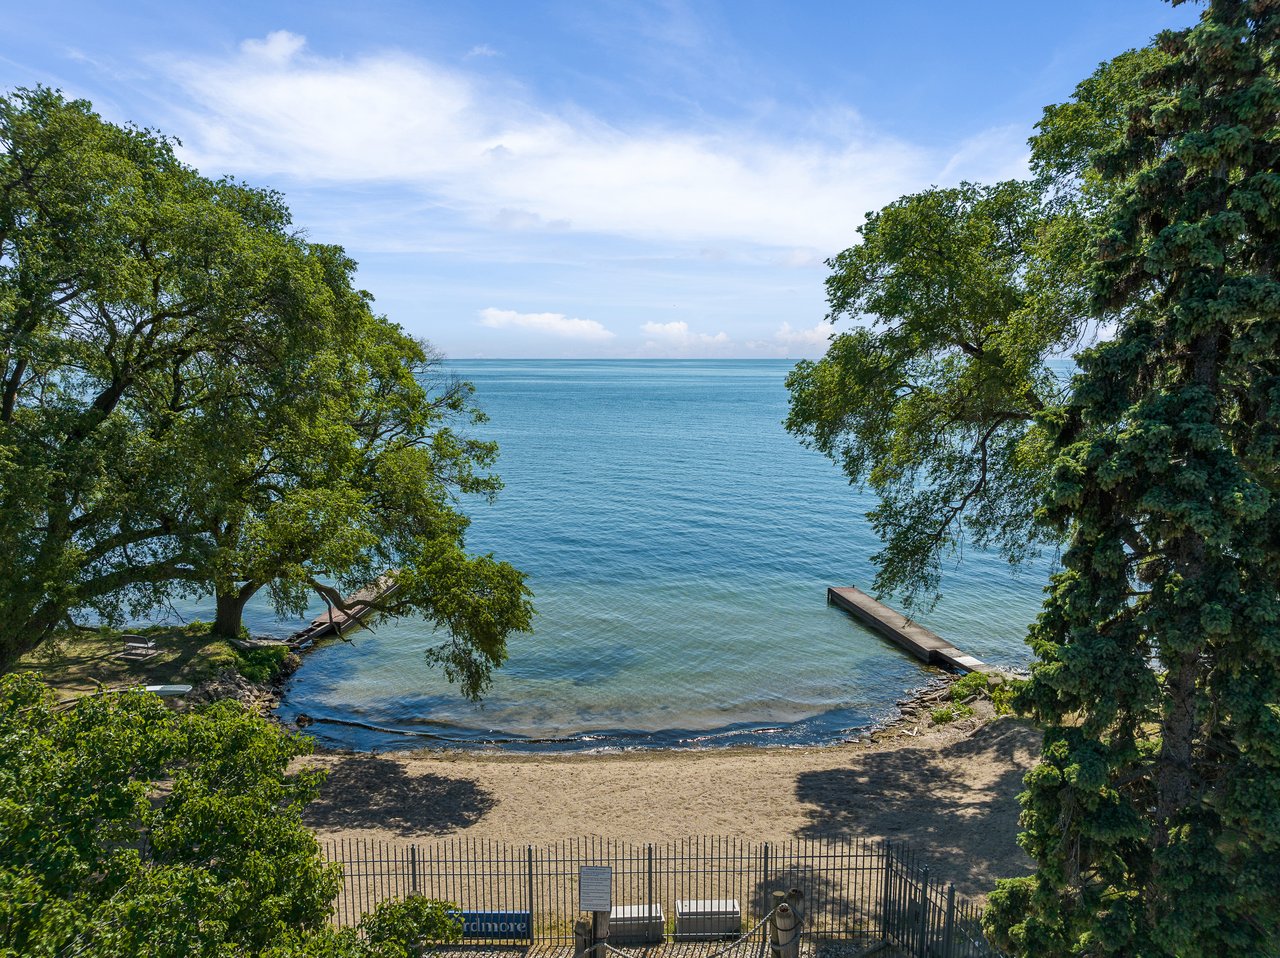
From off-market strategy and pre-market build-up to the marketing channels, agent pedigree, and pricing discipline that determine whether a premium property sells at t… Read more
Waterfront
Jeff Meldrum | February 10, 2025

Waterfront
Jeff Meldrum | March 18, 2026
Most waterfront homes on Lake St. Clair are marketed like interior homes — and sellers pay the price. Here's what intentional waterfront marketing looks like and why i… Read more

Waterfront
Jeff Meldrum | March 10, 2026
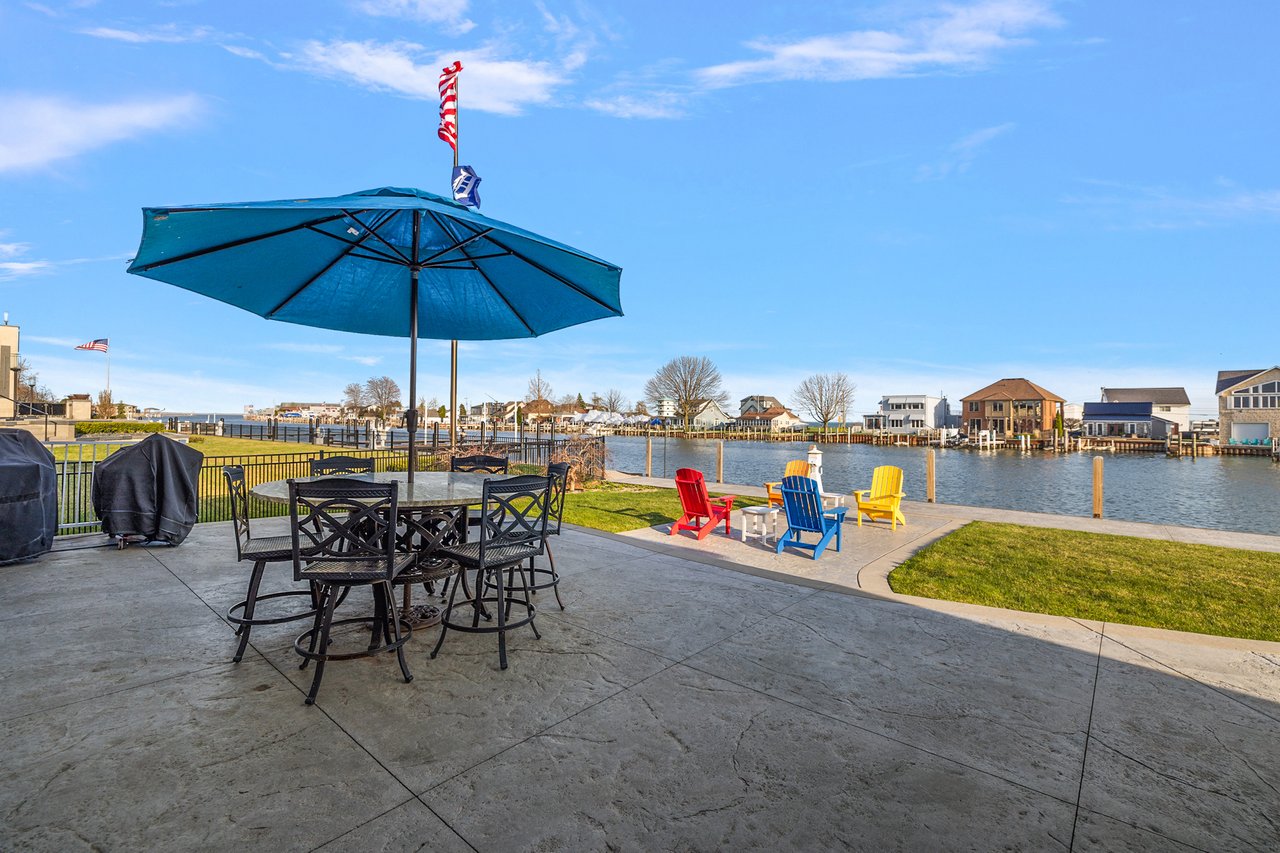
Canal Front vs. Direct Lakefront on Lake St. Clair: What's the Price Difference?
Waterfront
Jeff Meldrum | March 3, 2026
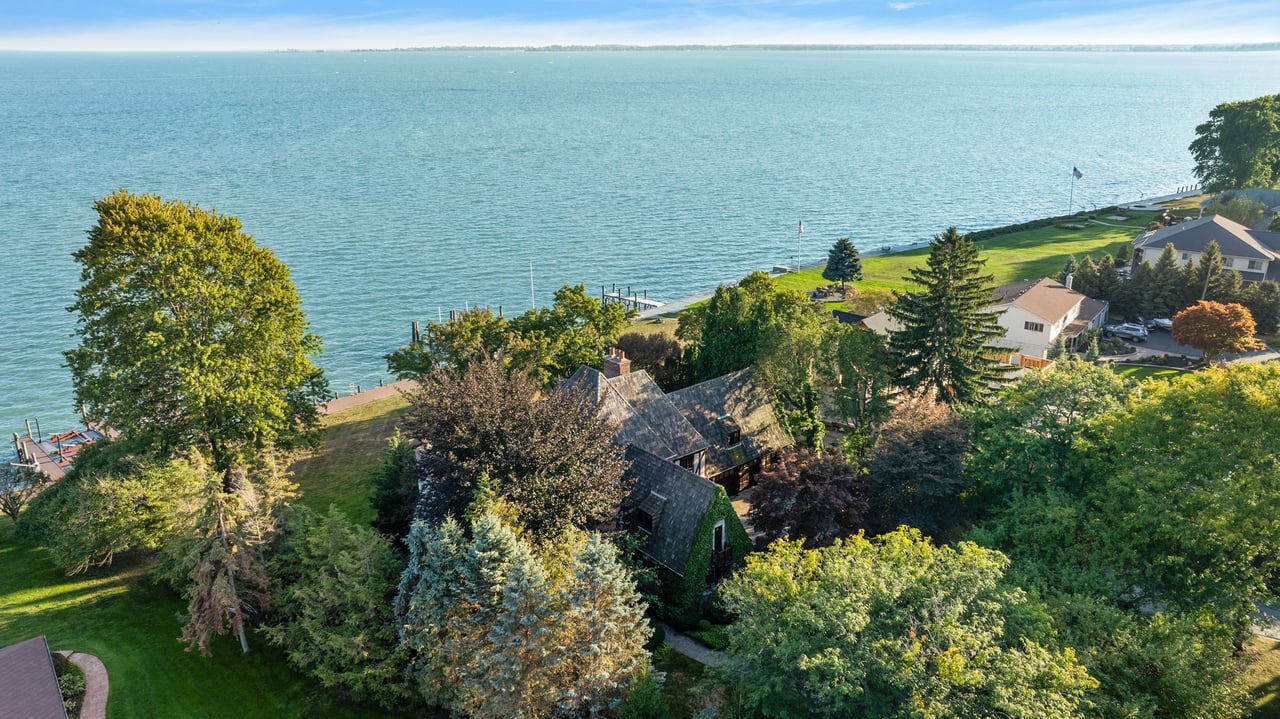
The $500K+ Segment: What Serious Buyers & Sellers Need to Know
Lake St. Clair
Jeff Meldrum | March 2, 2026
Selling your Lake St. Clair waterfront home in Harrison Twp, Chesterfield, St. Clair Shores, or Grosse Pointe? Learn what drives waterfront value, what the market is d… Read more
Waterfront
Jeff Meldrum | March 18, 2026
Find out what your Lake St. Clair waterfront home is worth in 2026. Canal depth, frontage, dock value, and current market data — explained by SE Michigan's #1 waterfro… Read more
Grosse Pointe
Jeff Meldrum | December 17, 2024
Serious Buyers
Grosse Pointe
Jeff Meldrum | March 10, 2024
A Suburban Haven